Investment a curmudgeon
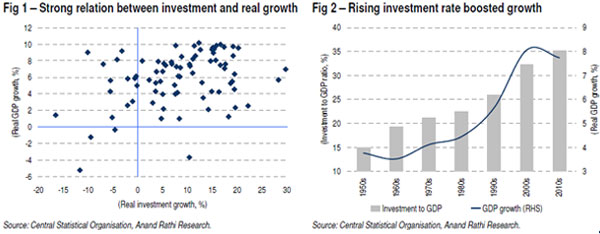
India’s real GDP growth has nose-dived to 5.3% in 4QFY12 from 9.2% in 4QFY11, following a sharp dip in investment – down to 5.8% between 1QFY11 and 4QFY12 from 18.5% in FY04-08. GDP and investment growth rates are strongly correlated in India, with a coefficient of 0.72. The broad-based and prolonged investment slowdown, especially the sluggish corporate and manufacturing investment, clouds India’s growth prospects.
Growth revival needs investment recovery
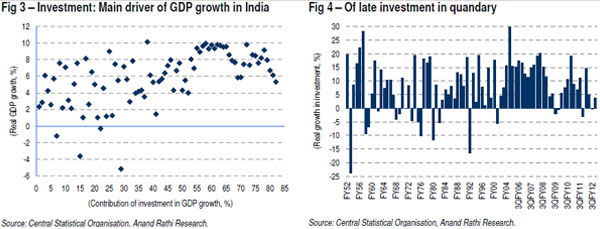
GDP-investment growth inter-linked in India. GDP and investment growth in India exhibit a strong correlation (see Fig 1), which has strengthened over time – to 0.58 in FY80-12 from 0.35 in FY52-12, and further to 0.72 between 1QFY06 and 4QFY12. Consequently, the investment-GDP ratio in India has increased in successive decades,
generally leading to acceleration in GDP growth (see Fig 2). In periods when investment contributed to more than 50% of GDP growth, the resultant GDP growth has generally been 8% and above (see Fig 3). In contrast, whenever the contribution of investment to GDP growth has been less than 30%, India’s GDP growth rarely crossed 6%. Therefore, unless the investment environment in India improves, there is little hope for a strong rebound in GDP growth from the 5.3% level registered in 4QFY12.
Consensus foresees growth slump in FY13. The yearly GDP growth of 6.5% in FY12 is the least in past nine years. India had registered a similar slowdown post the Global Recession of 2008 when GDP growth decelerated to 5.8% in 3QFY09 from 9.6% in 3QFY08. Growth had, however, reverted quickly to 9.8% by 2QFY10 (see Fig 4) as investment growth picked up to 19.4% in 4QFY10 after sliding to (-0.6%) in 4QFY09 (from 20.2% in 2QFY08). However, this time around, investment growth has been volatile, averaging only 5.8% during the past eight quarters (1QFY11-4QFY12) (see Fig 4). Hence, the consensus fears a prolonged slowdown in India with growth in FY13 likely to slip below 6% for the first time in a decade.
Multi-dimensional investment slowdown
All major investment and related indicators show deterioration in investment performance since mid-2011:
- For the first time since 2004, seasonally adjusted fixed investment data show sharp contraction for three successive quarters since Sep’11. Currently, the value of fixed investment in real terms is at the same level as in Mar’10.
Private and manufacturing capex wet blanket
Sluggish corporate and manufacturing capex. Disaggregated data on investments in India suggest that in the ownership-wise category, corporate (private) investment is the most dynamic component. On the other hand, manufacturing is the most vibrant part of use-based investment. The major reason for the lacklustre performance of investment demand in India is that investment in both these categories shrunk sharply in FY09 and in real terms could not recover to the FY08 levels even by FY11.
Corporate capex the worst performer post 2008. The corporate sector, contributing nearly 40% to overall investments in India, has remained subdued since FY09. After registering a median yearly growth of 33% during FY06-08, it fell 30% in FY09. Consequently, overall investment contracted 2% in FY09 from 17% growth in the previous year. Decline in overall investment would have been even sharper in FY09 had the household sector, another key contributor, not grown 31%.
Household investment out of steam. This component, comprising over one-third of overall investment, has lost its share in overall investment by 250bps in FY09-11, to 34.1%. In such situation, public sector capex ought to have played a counter-cyclical role, aiding overall growth in investment and economy. Unfortunately, this is not quite the case for India, where the government is ailing with revenue deficit (inter alia on account of tax cuts targeted at stimulating consumption, and sharp increase in current expenditure like subsidy payments).
Globally, companies increasing cash holding. Corporate investment globally is down following the Great Recession of 2008. Such a slowdown can happen either due to funding crunch or subdued outlook for return on investment. The coexistence of falling debt-equity ratio and low investment in the corporate sector of the developed countries like the US indicates, rather than availability of funding, subdued future return expectations are holding back corporate investment in those countries.
Return expectations a drag for large Indian companies. Among the bigger Indian companies, proportion of those with net cash as opposed to net debt has increased in the recent past. Among the non-financial companies in Nifty which have published their FY12 balance sheet, those with net cash outnumber the ones with net debt. This is in sharp contrast to the situation that prevailed in FY05-11. Yet, the net gearing of these companies does not show any perceptible change in FY12. In fact, net gearing rose sharply in FY09 and despite some fall thereafter, remained high in FY11-12 against FY07-08. This is despite fall in the growth of net borrowing by these companies during FY10-12. Therefore, it appears that while lack of funding restrained investment by the bigger companies, subdued return outlook also had a role to play.
Access to funding bigger issue for smaller companies. Among the smaller private companies, represented by non-financial companies in CNX-mid-cap, there has not been any perceptible improvement in net cash position even in FY12. With the drying up of funding opportunities during FY10-11, along with fall in net debt, gearing of these companies reduced. With acceleration in borrowing during FY12, gearing for smaller companies has however reverted to the FY09 level. Hence, lack of access to funding played a bigger role in depressing investment by smaller companies versus their larger counterparts.
Moribund manufacturing capex a serious concern. Manufacturing saw the sharpest deterioration in investment since 2008, declining more than 30% in 2009. Despite a smart recovery in 2010, value of such investments in 2011 remained below the 2008 level. Manufacturing and infrastructure sectors are far more capital intensive than services or agriculture. Manufacturing alone accounts for one-third of India’s capex. Together with infrastructure, it accounts for half of the country’s capex. This explains why investment climate in India has remained soft since 2009. But for a contraction in 2010, services investment, the largest component in use-based investment classification, maintained low but steady growth.
(Sujan Hajra is Co-Head, Research, and Chief Economist, Institutional Equity, Anandrathi Financial Services.)